Survey Response Rates
| September 2022 | July 2023 | |
|---|---|---|
| Complete responses (total) | 1015 | 825 |
| Complete responses (English) | 823 | 691 |
| Complete responses (Spanish) | 192 | 134 |
| DAP Recipients | 2242 | 2242 |
| Overall response rate | 45% | 37% |
Note:About 300 Wave 2 respondents did not respond to the Wave 1 survey.
Survey Demographics
| All program recipients | Wave 1 Survey Respondents | Wave 2 survey Respondents | |
|---|---|---|---|
| Female | 64% | 62% | 64% |
| Male | 35% | 38% | 35% |
| Black | 40% | 38% | 39% |
| Hispanic | 23% | 32% | 27% |
| White | 31% | 25% | 29% |
| Age | 45.4 years | 42.5 years | 44.2 years |
| Married | 36% | 33% | |
| High School Graduate | 87% | 86% | |
| Some College | 60% | 59% | |
| Children (number) | 1.5 | 1.5 | |
| Household Size | 2.8 people | 2.8 people | 2.8 people |
| Income (annual) | $22,687 | $22,643 | $23,218 |

Blank Surveys
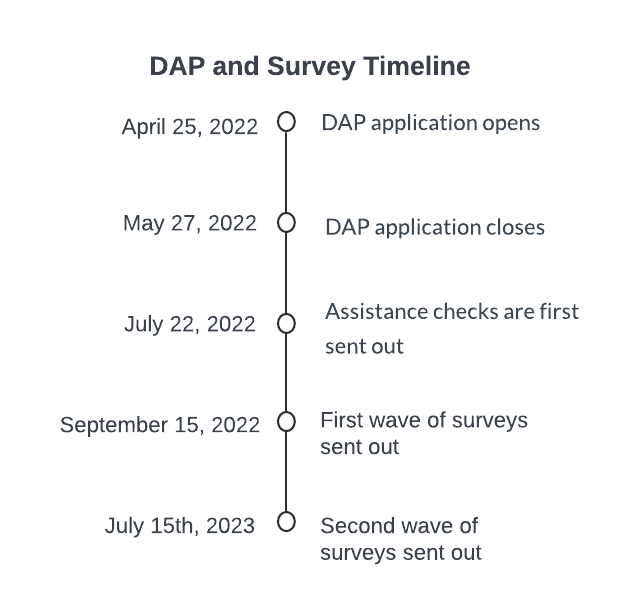
Read below exactly what our surveys stated. The first page shared instructions.

Spending Patterns
Read the breakdown of how individuals spent the $1,400 assistance, including how the breakdown varies among demographics.

Debt
Explore how the assistance impacted debt in the short and long run, including various types of debt payments.

Trust in Government
Did receiving the assistance change how recipients felt about the government at different levels, from local to federal?

Housing Security
70% of low-income Johnson County households are housing cost burdened, meaning they spend more than 30% of their income on housing, according to United Way.
Results coming soon.

Health
Explore the ways the direct assistance impacted health factors, such as mental wellbeing and the likelihood of delaying care.
Results coming soon.