
Largest Spending Categories
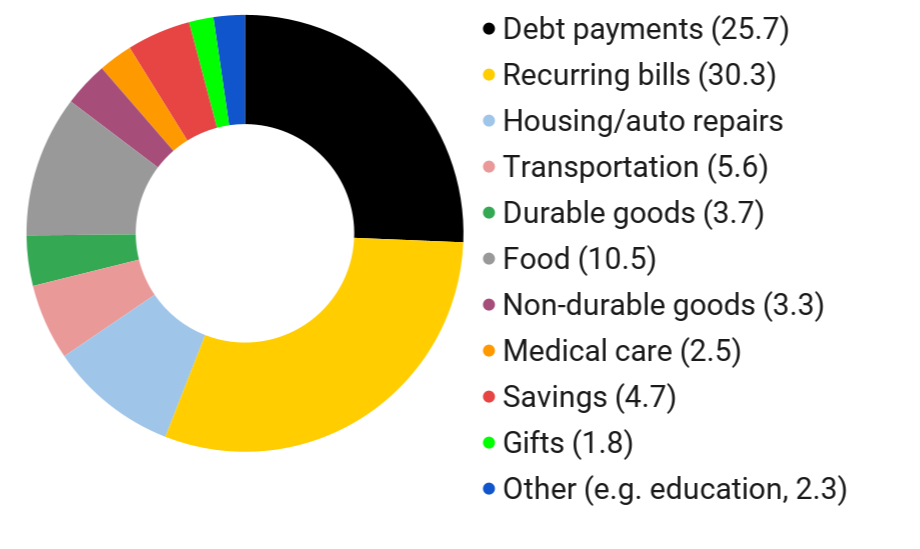
The largest spending categories, on average, were:
- Recurring bills (e.g. rent, water, electricity, debt payments etc,): $419
- Debt payments: $356
- Food: $143
- Housing or auto repairs: $132
- Transportation, like gas or bus fare: $79
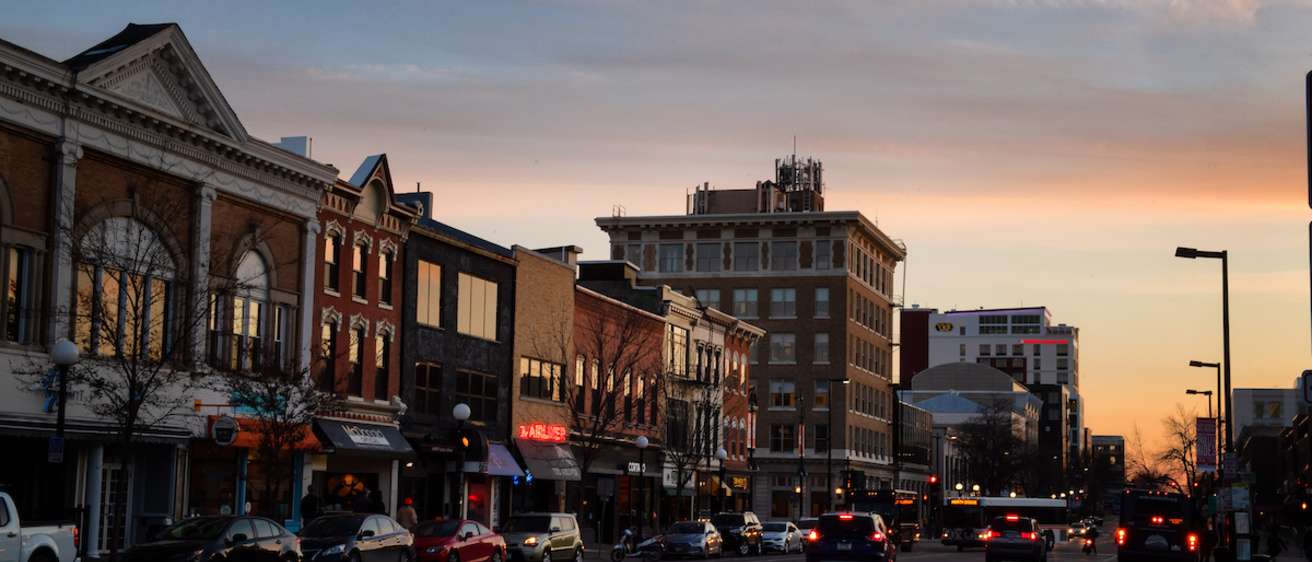
25 percent of Johnson County households cannot afford basic costs, like housing, transportation, utilities, and food, according to United Way. In our spending breakdown, we see individuals paying a majority of the assistance towards basic costs.
Spending Responses to Direct Cash Assistance to Low-Income Adults
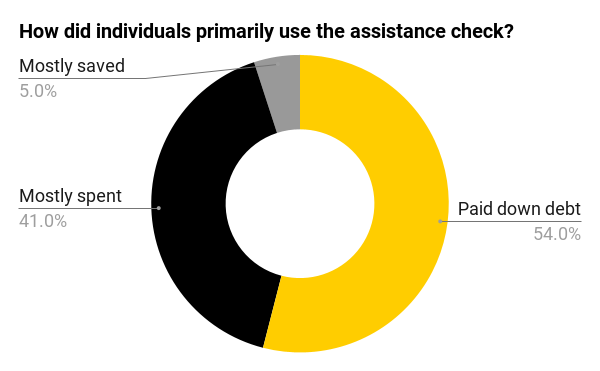
Results Summary
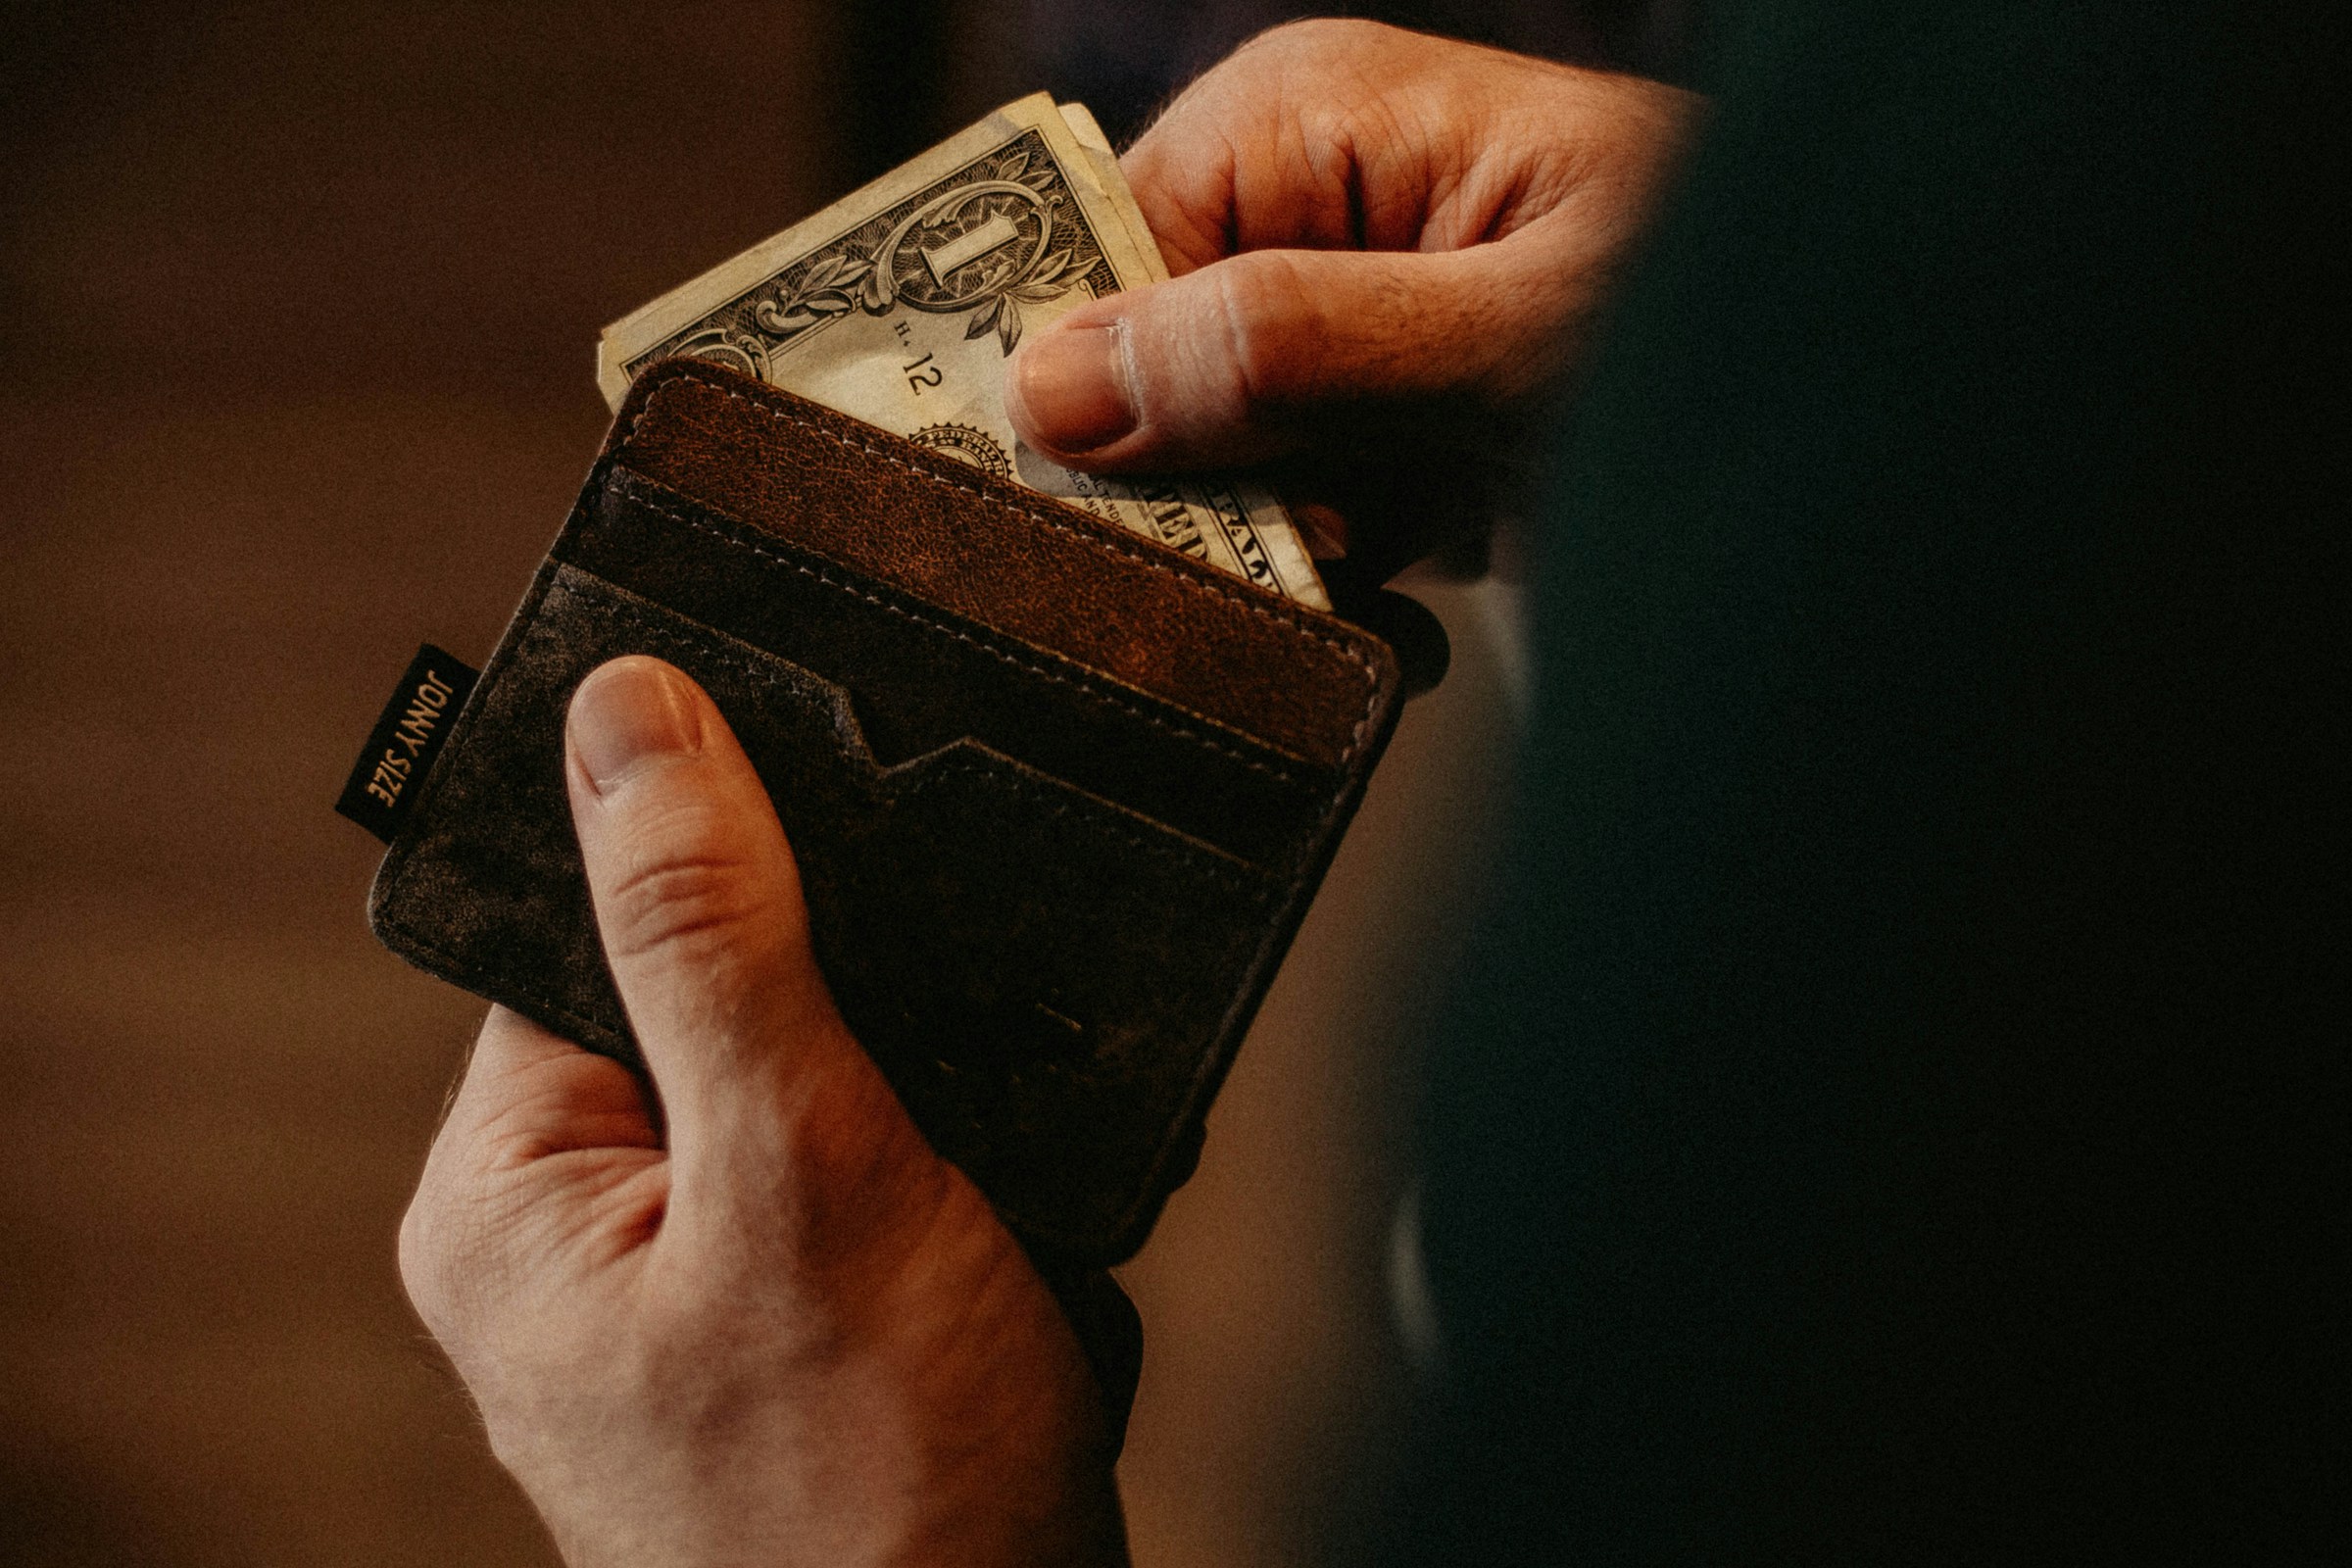
Individuals mostly paid down debt or mostly spent the $1,400 assistance. Only one out of every twenty participants had the ability to mostly save the check. Below, we highlight a more detailed breakdown of recipients' spending, including differences in demographics, and further in this website, we evaluate it's impact.
Spending Differences Among Socioeconomic Variables
Paid Down Debt
Paid Down Debt
- Those with debt were more likely to spend greater amounts of the assistance towards debt payments.
- Those with greater amounts of debt were slightly more likely to use more of the check towards debt payments.
- Those with some college or college were less likely to pay down debt than high school graduates (9 and 10 percentage points).
- Hispanic individuals were 21 percent more likely to mostly pay down debt with the assistance compared to non-Hispanic white individuals.
- Married individuals were 12 percent less likely to mostly pay down debt compared to non-married individuals.
Spent (Not Towards Debt)
Spent (Not Towards Debt)
- College graduates were 10 percent more likely to mostly spend the assistance compared to those with a high school education as their highest education level.
- Hispanic individuals had a 17 percent lower likelihood to mostly spend the cash payment compared to non-Hispanic white individuals.
- Married individuals were 10 percent more likely to mostly spend the assistance compared to non-married individuals.
- In households with 2 or more children, individuals were about 10 percent less likely to mostly spend the check compared to those without children.
Saved
Saved
- Non-Hispanic Black individuals were 6 percent less likely to save the assistance compared to non-Hispanic white individuals.
- Individuals with children were less likely to save the cash assistance compared to those with no children. Specifically, those with 1 child were 7 percent less likely, and those with 3 or more children were 6 percent less likely.
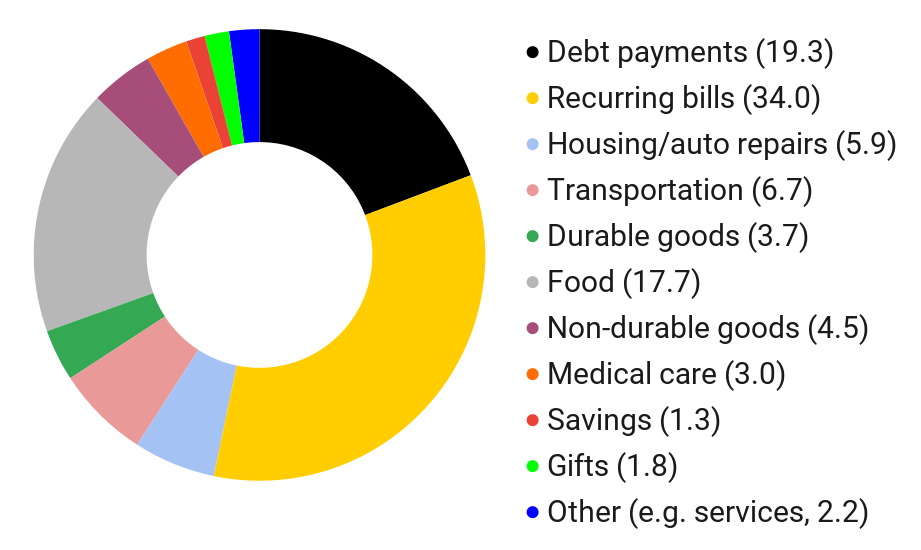
Spending Patterns Comparison
Below, we compare the averages of how the assistance check was spent to a typical month's spending for survey respondents.